Isioma Ochei

Get To Know More
About Me
I’m a UI/UX Designer with a passion for crafting intuitive digital experiences and visually engaging data interfaces. With a strong foundation in user-centered design, I specialize in building clean, accessible interfaces — from landing pages to dashboards to mobile applications, with industry related tools like Figma, Framer, and also building with Code related technologies like HTML, CSS/TailwindCSS and Boostrap.
Education
B.Sc in Chemistry
Explore My
Experience
Designer Related
Figma
Framer
Adobe XD
Photoshop
Rive
Coder Related
HTML
TailwindCSS/CSS
Bootstrap
View My
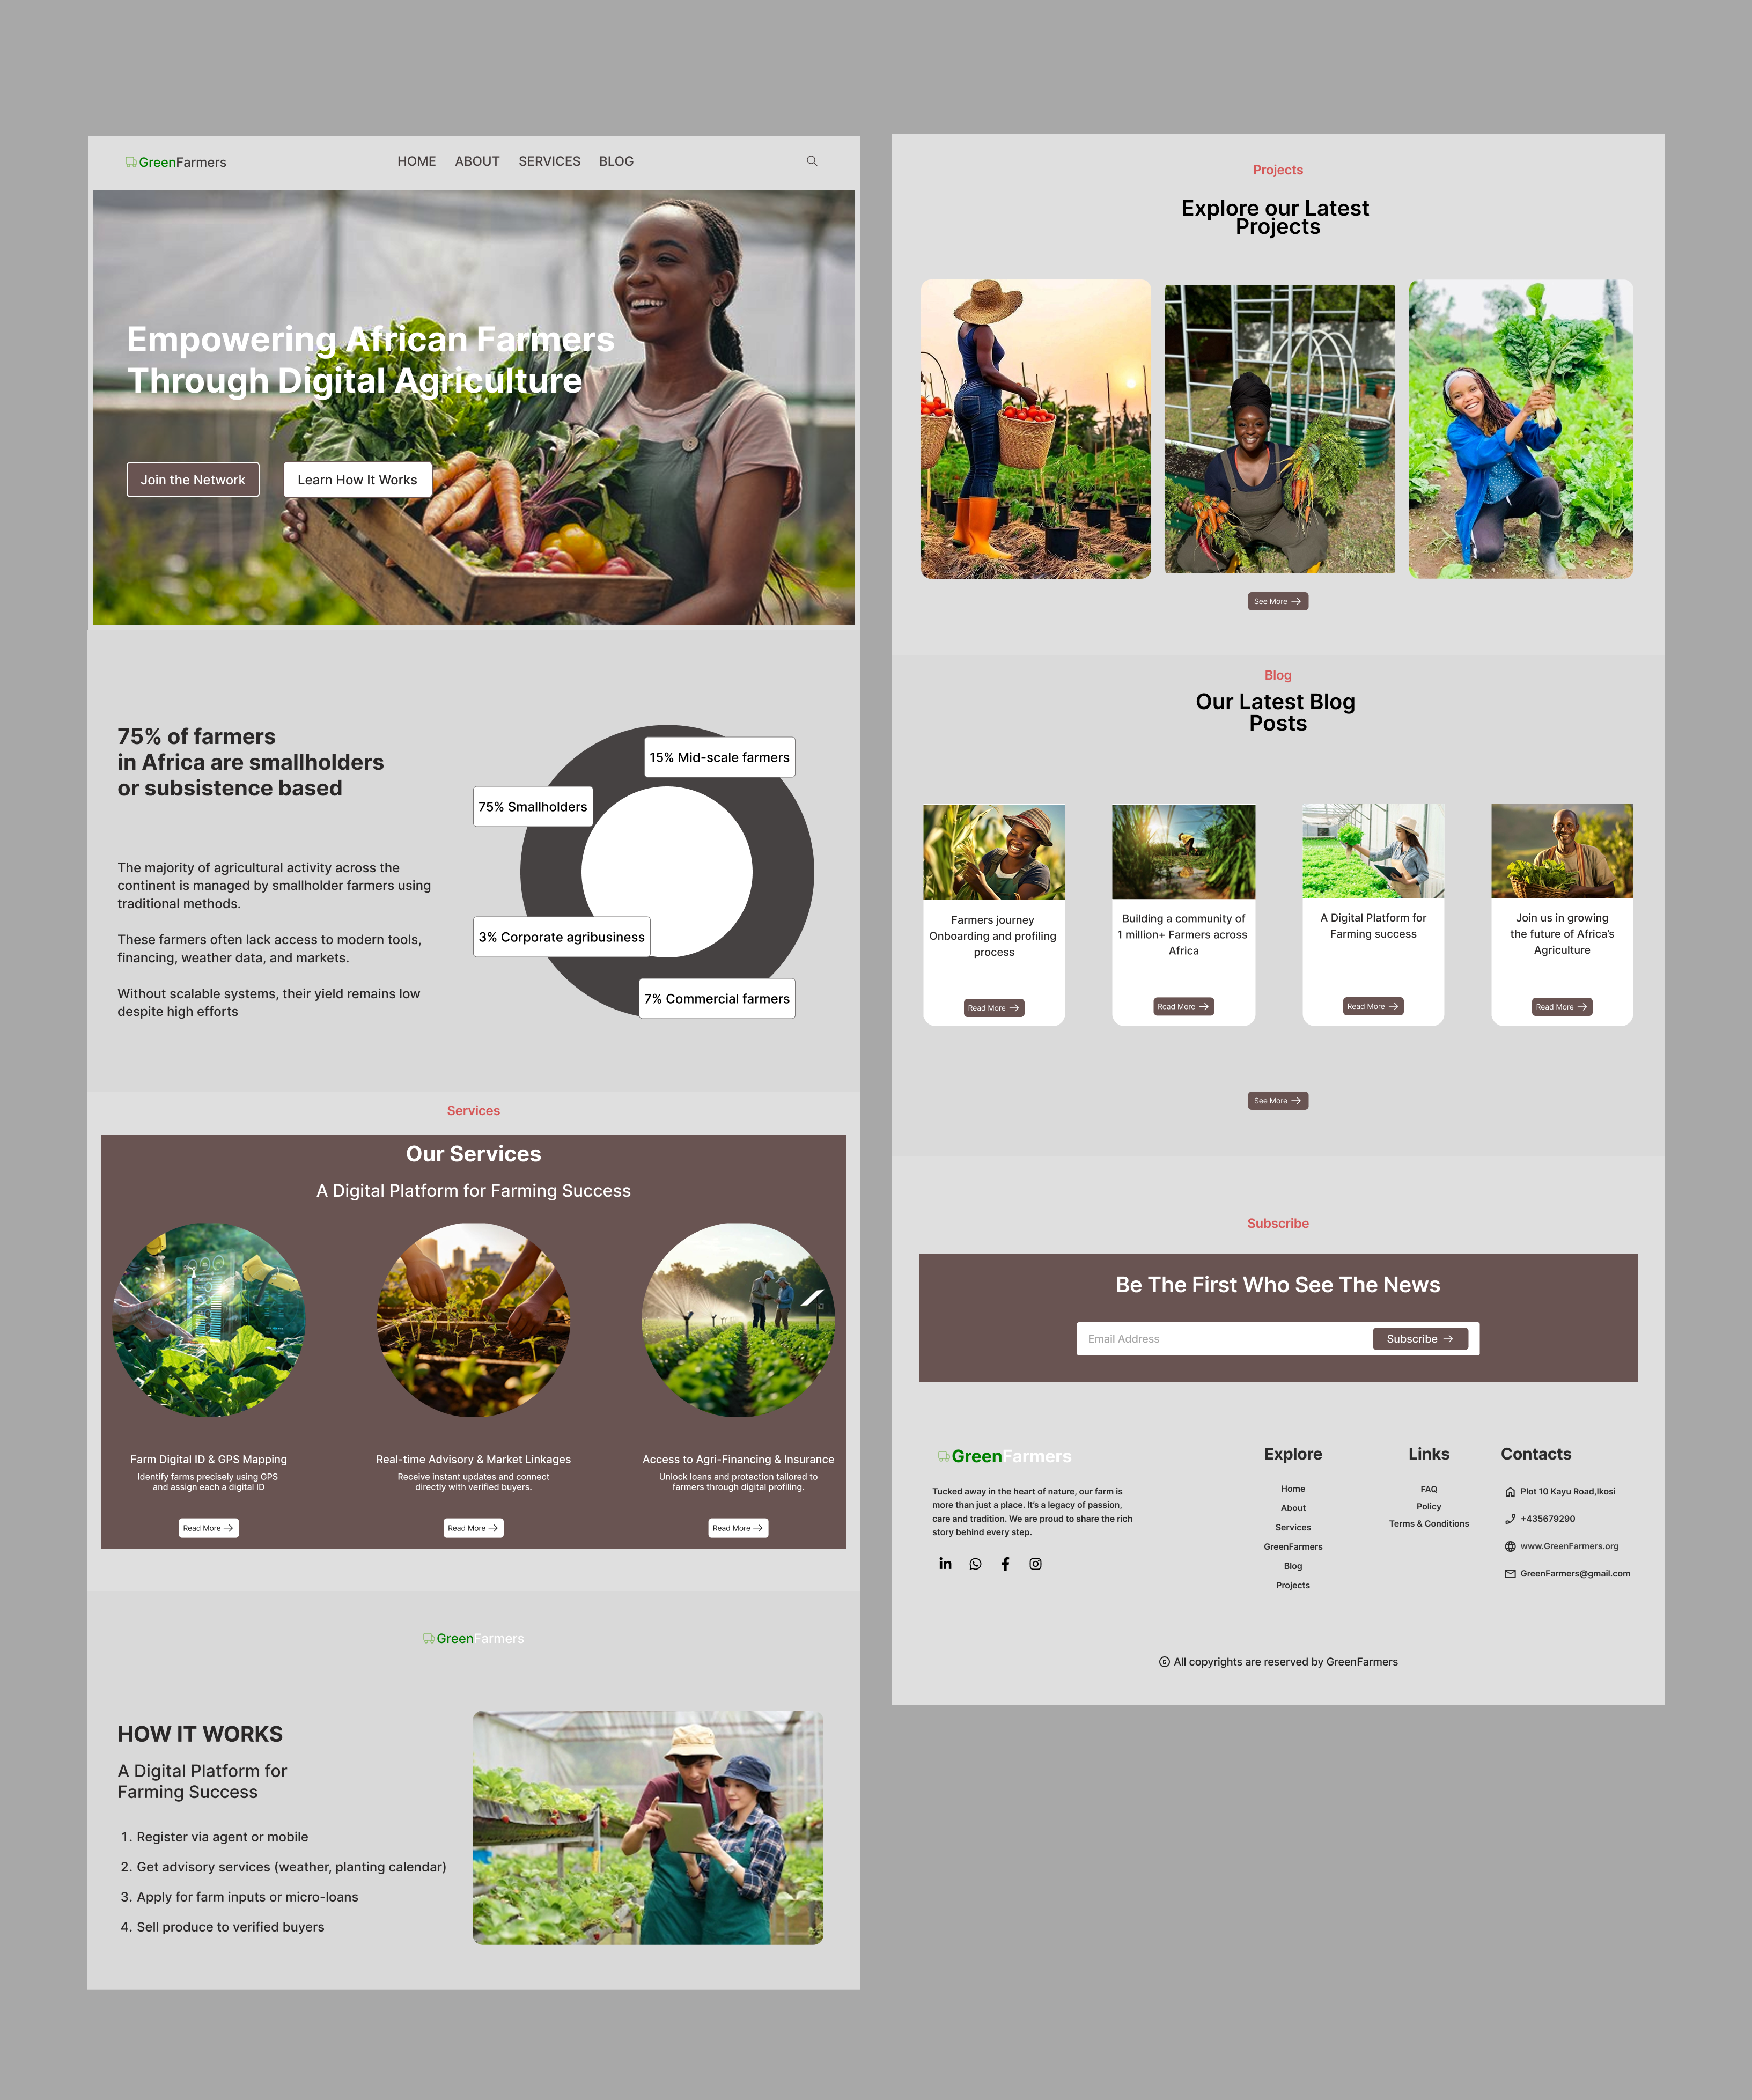
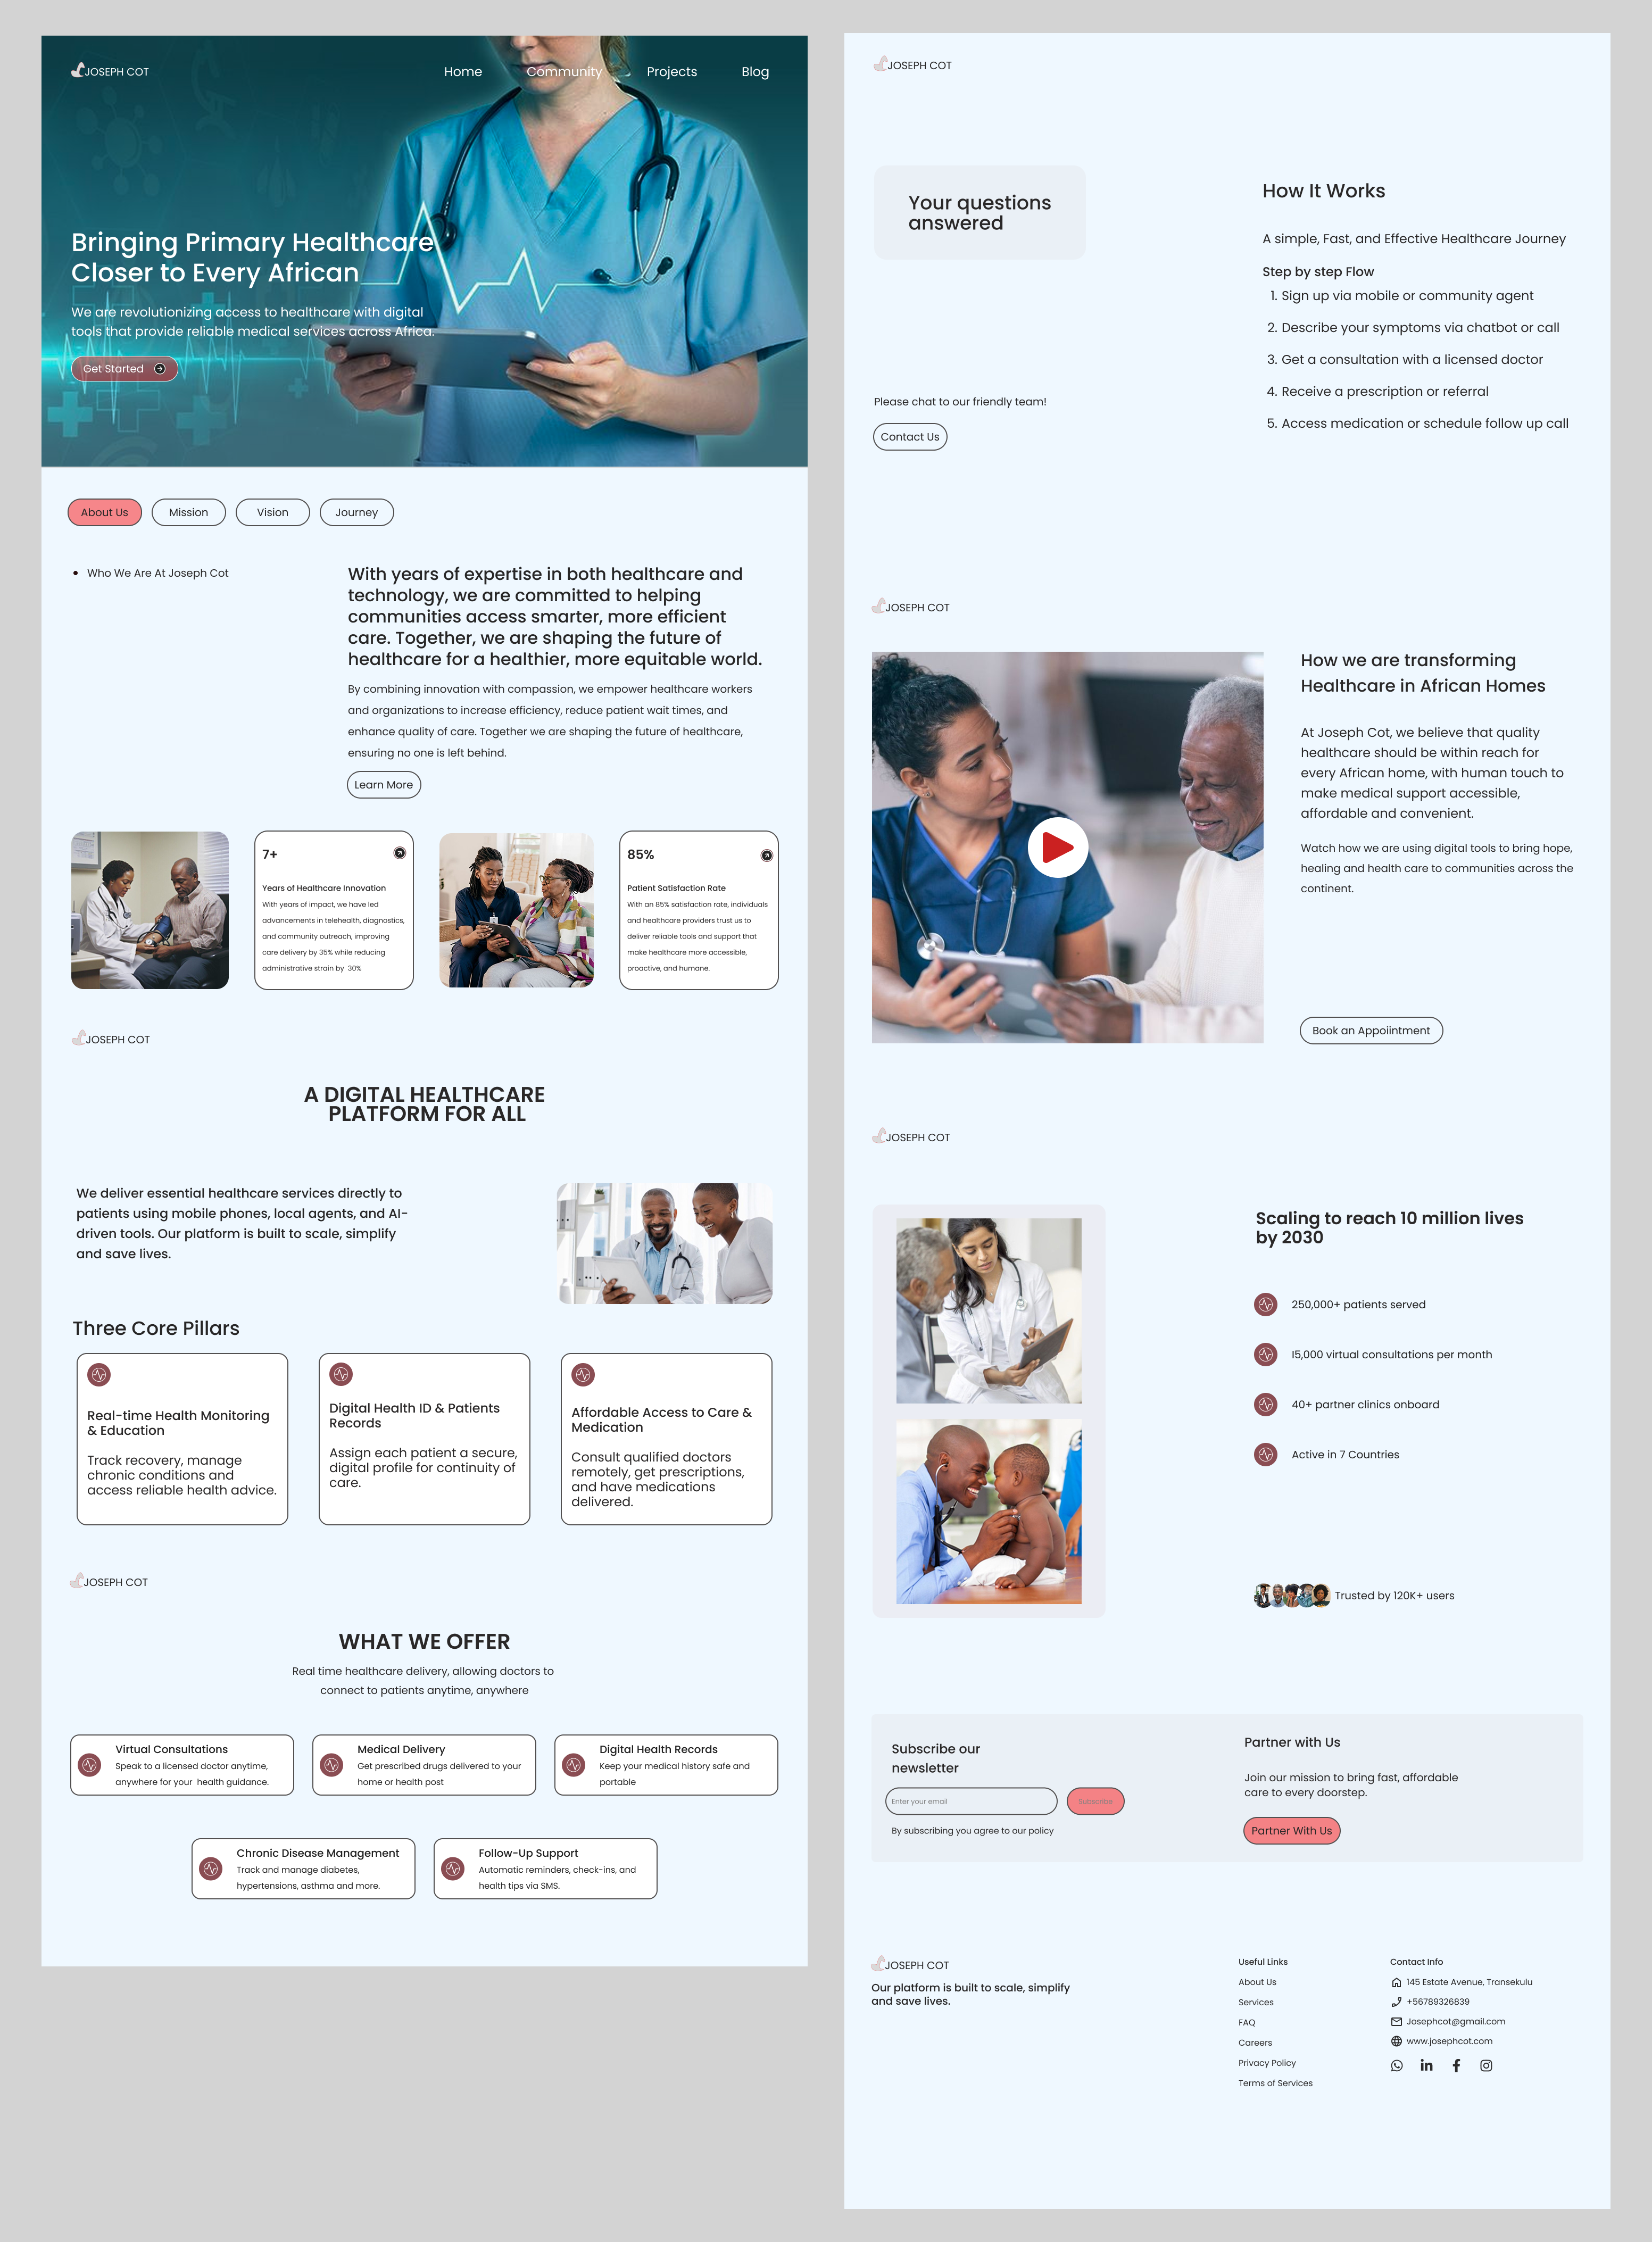
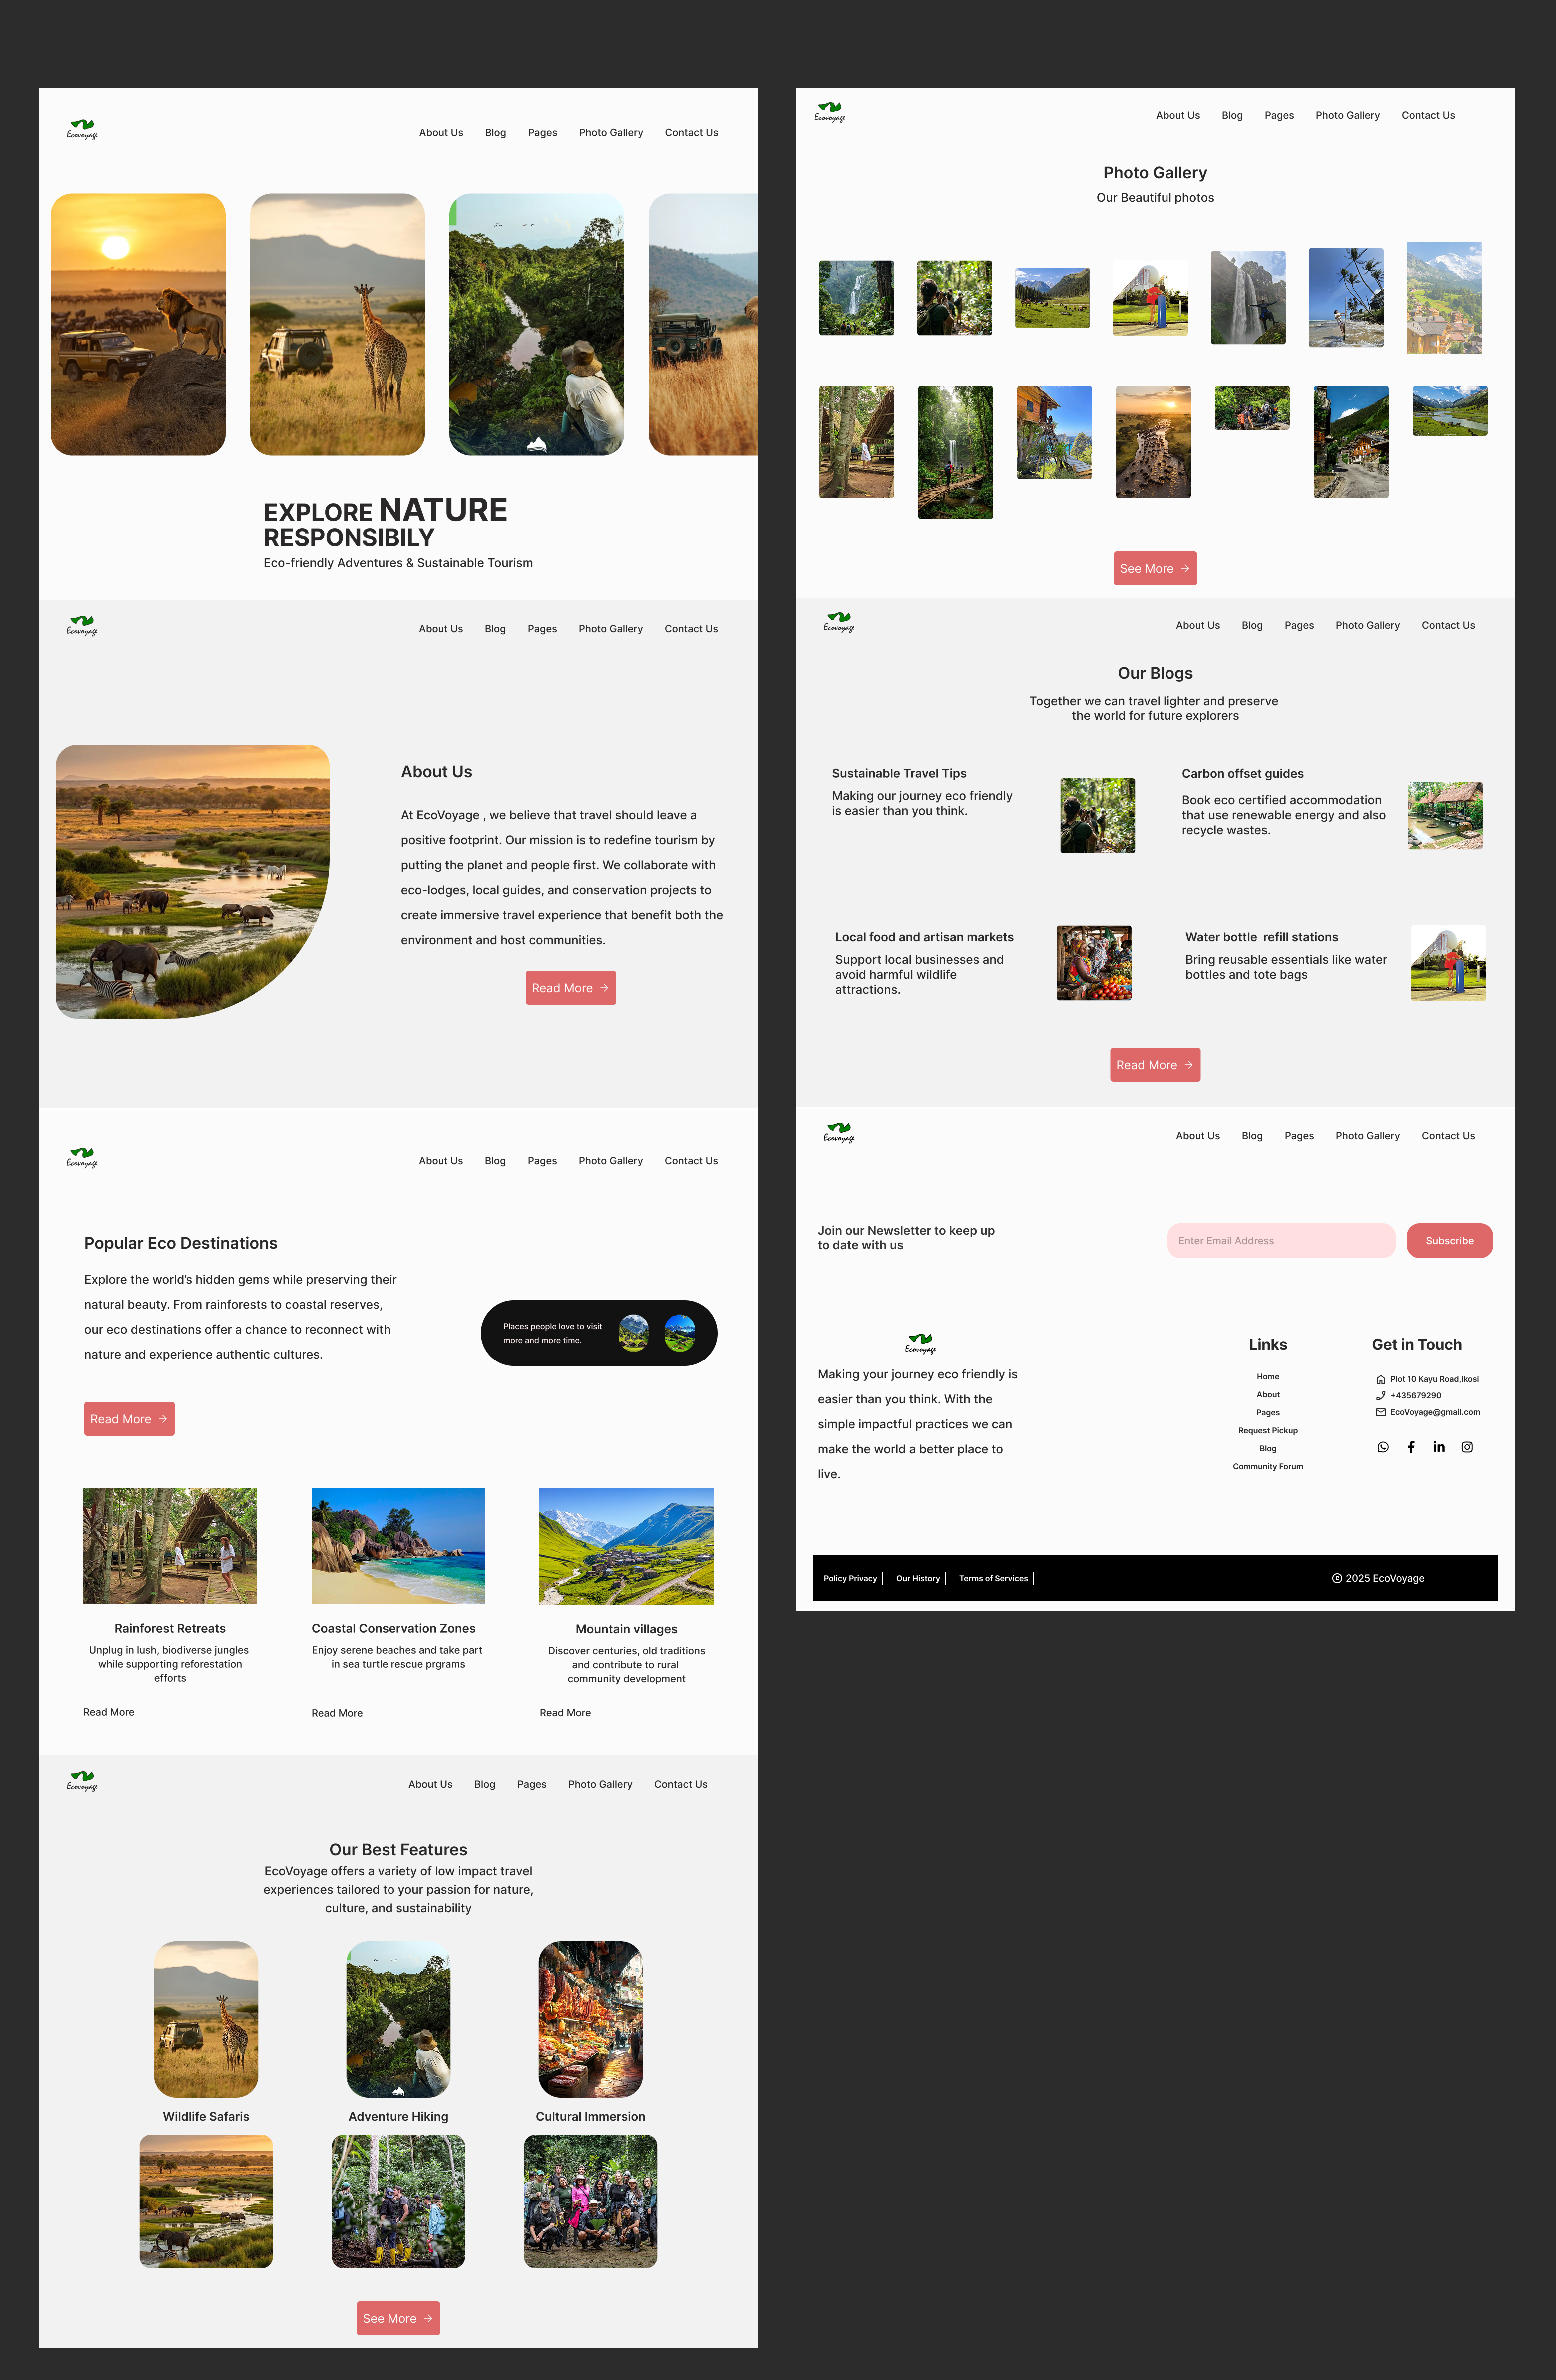
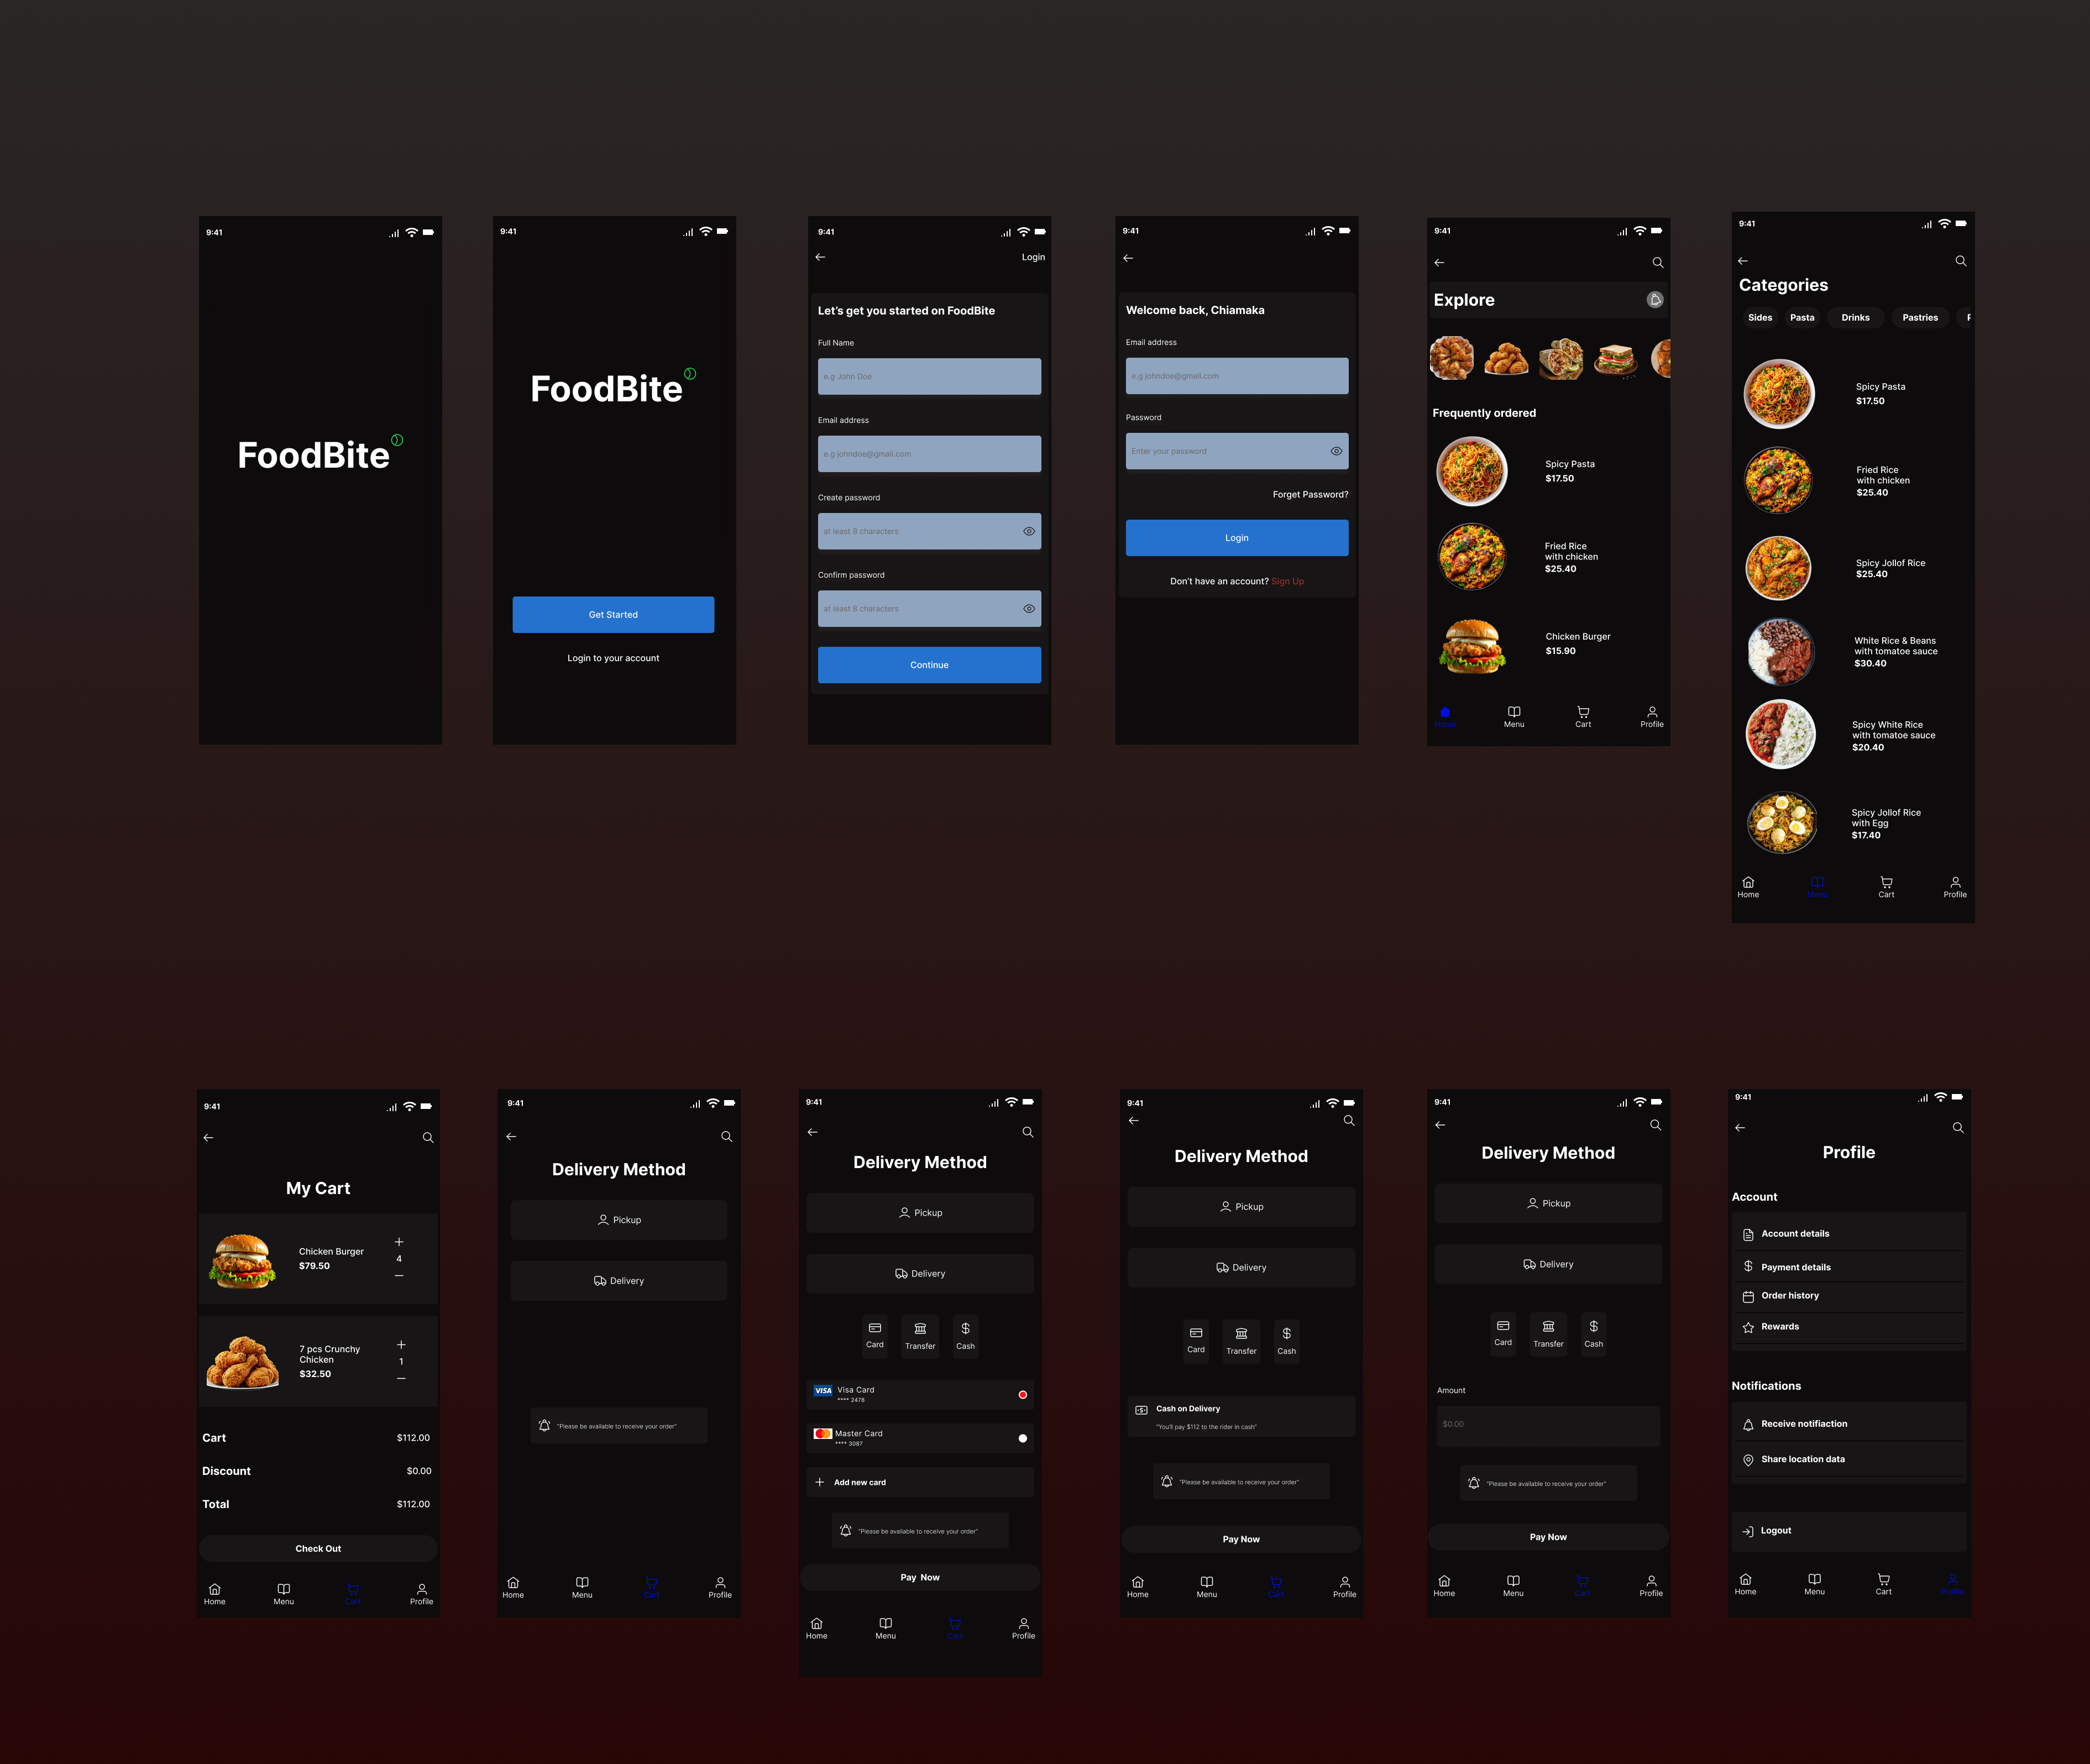
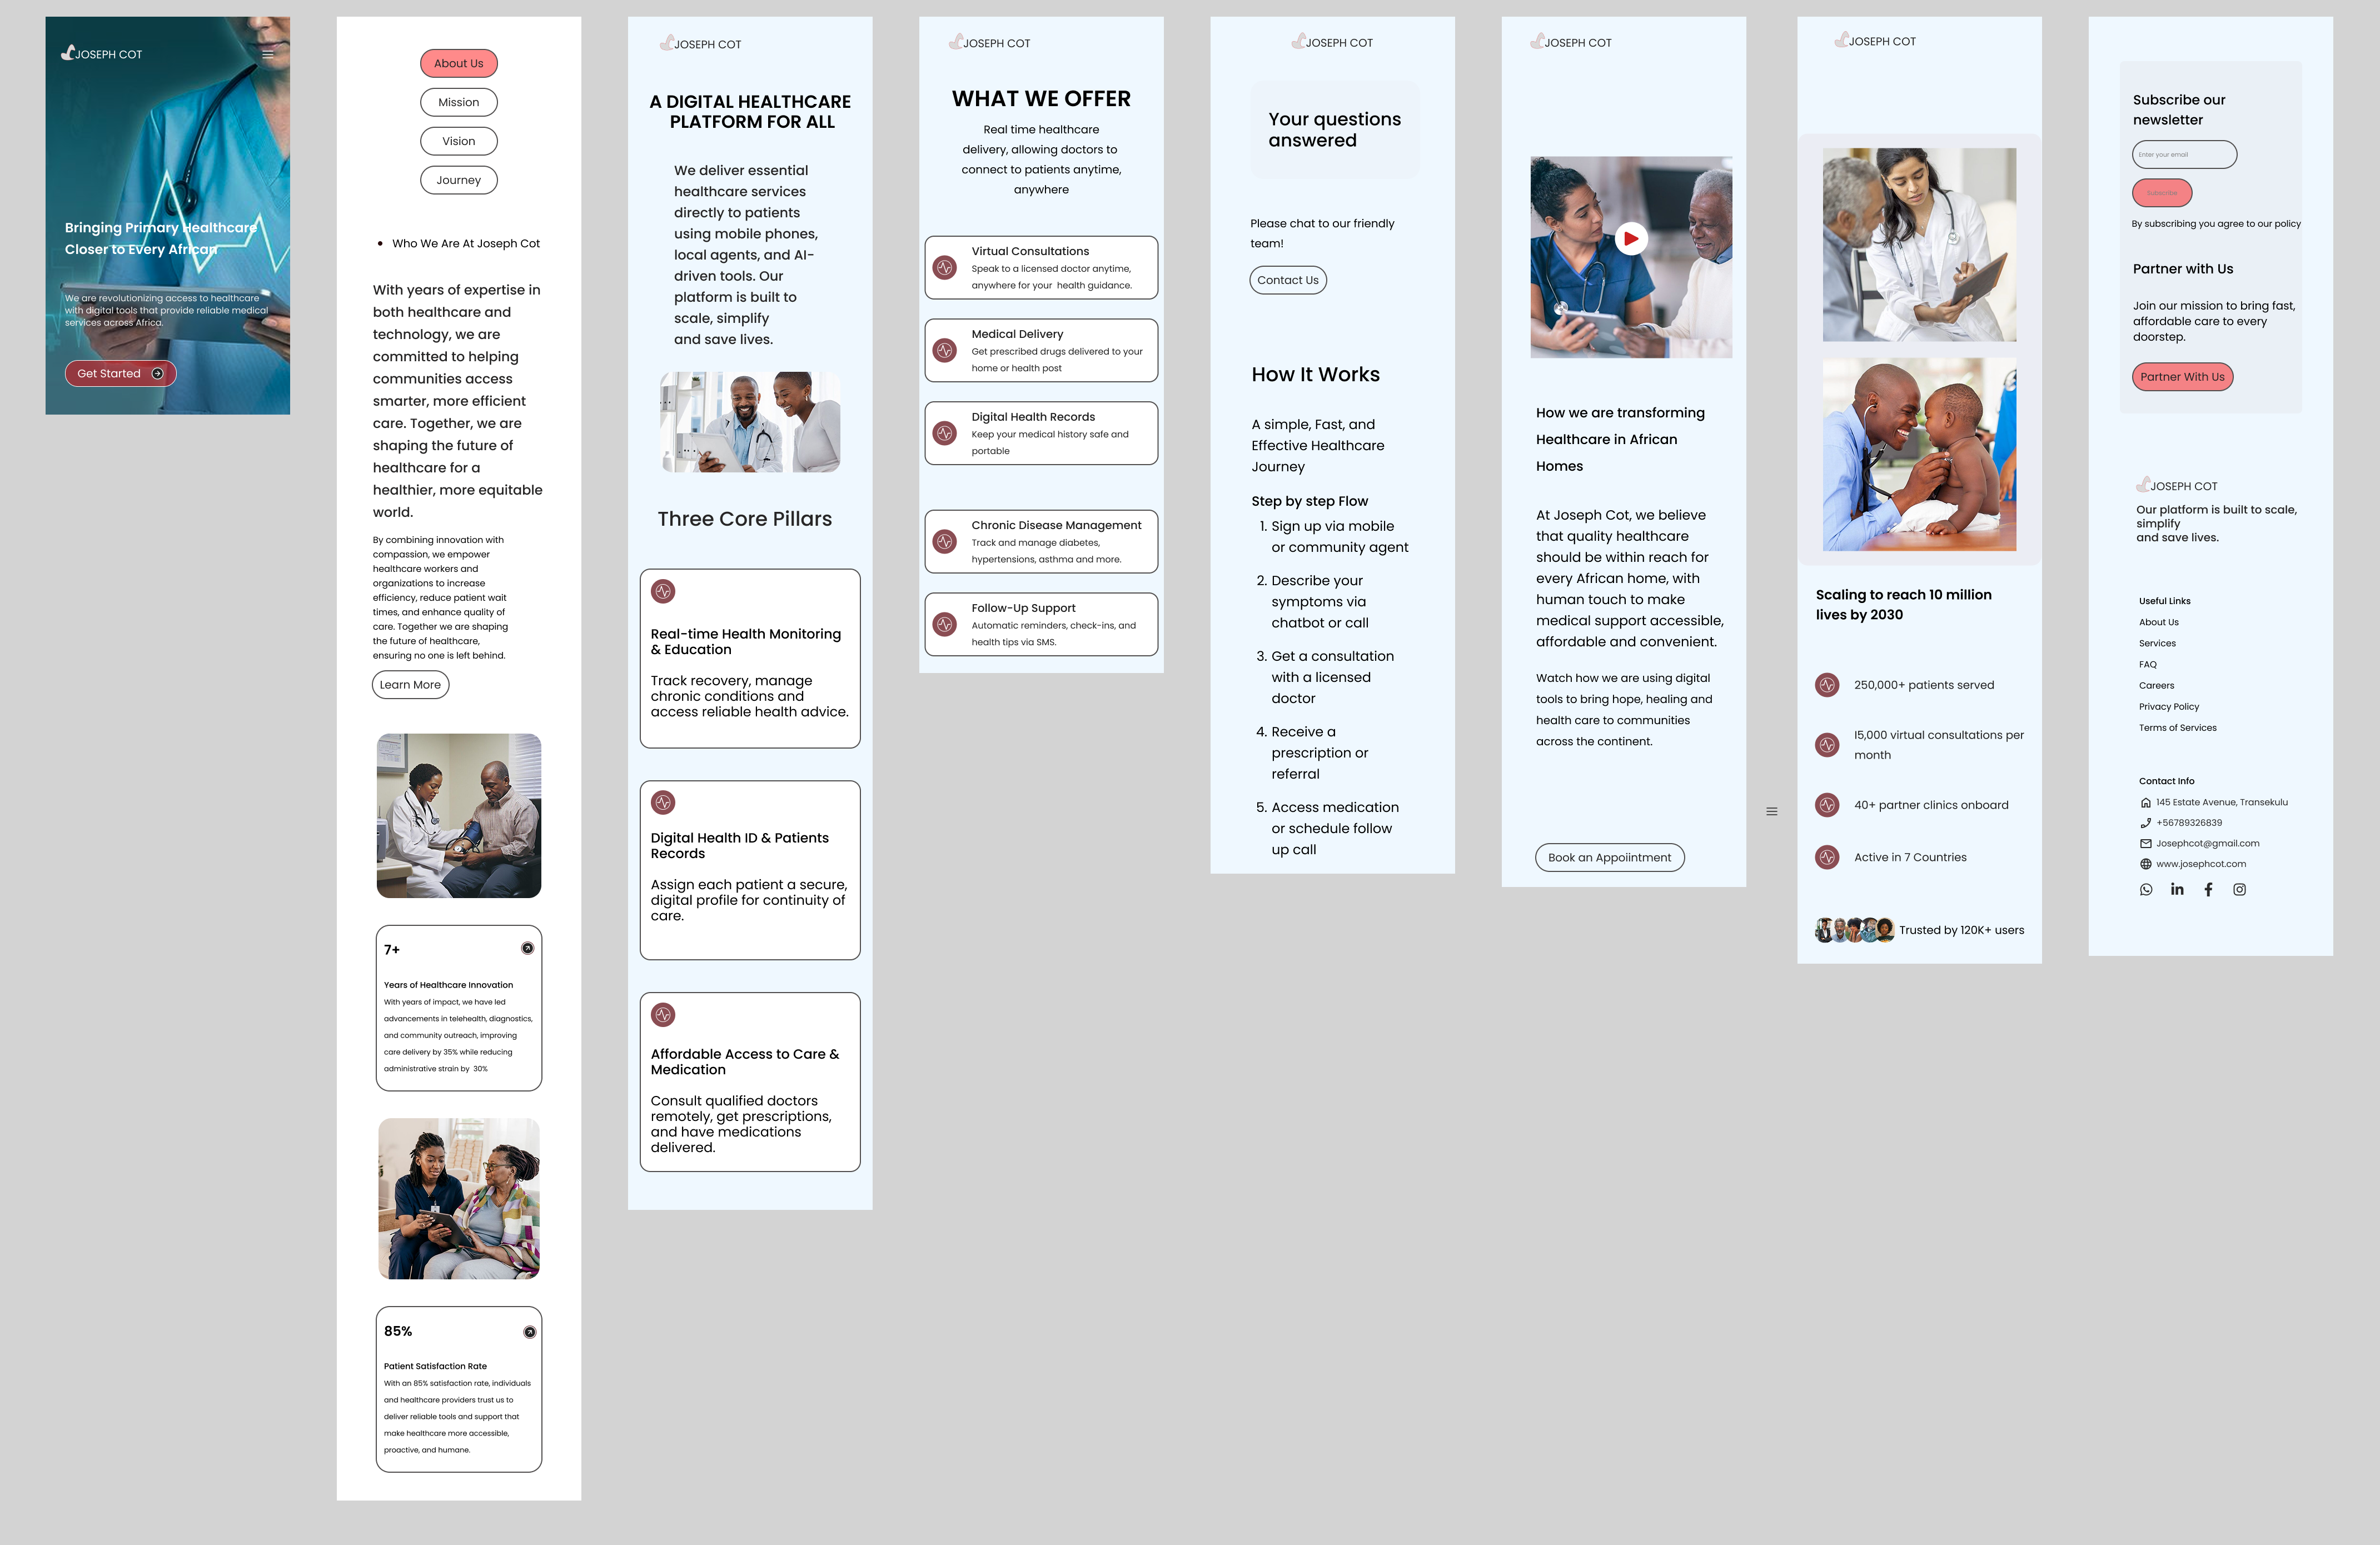
Projects
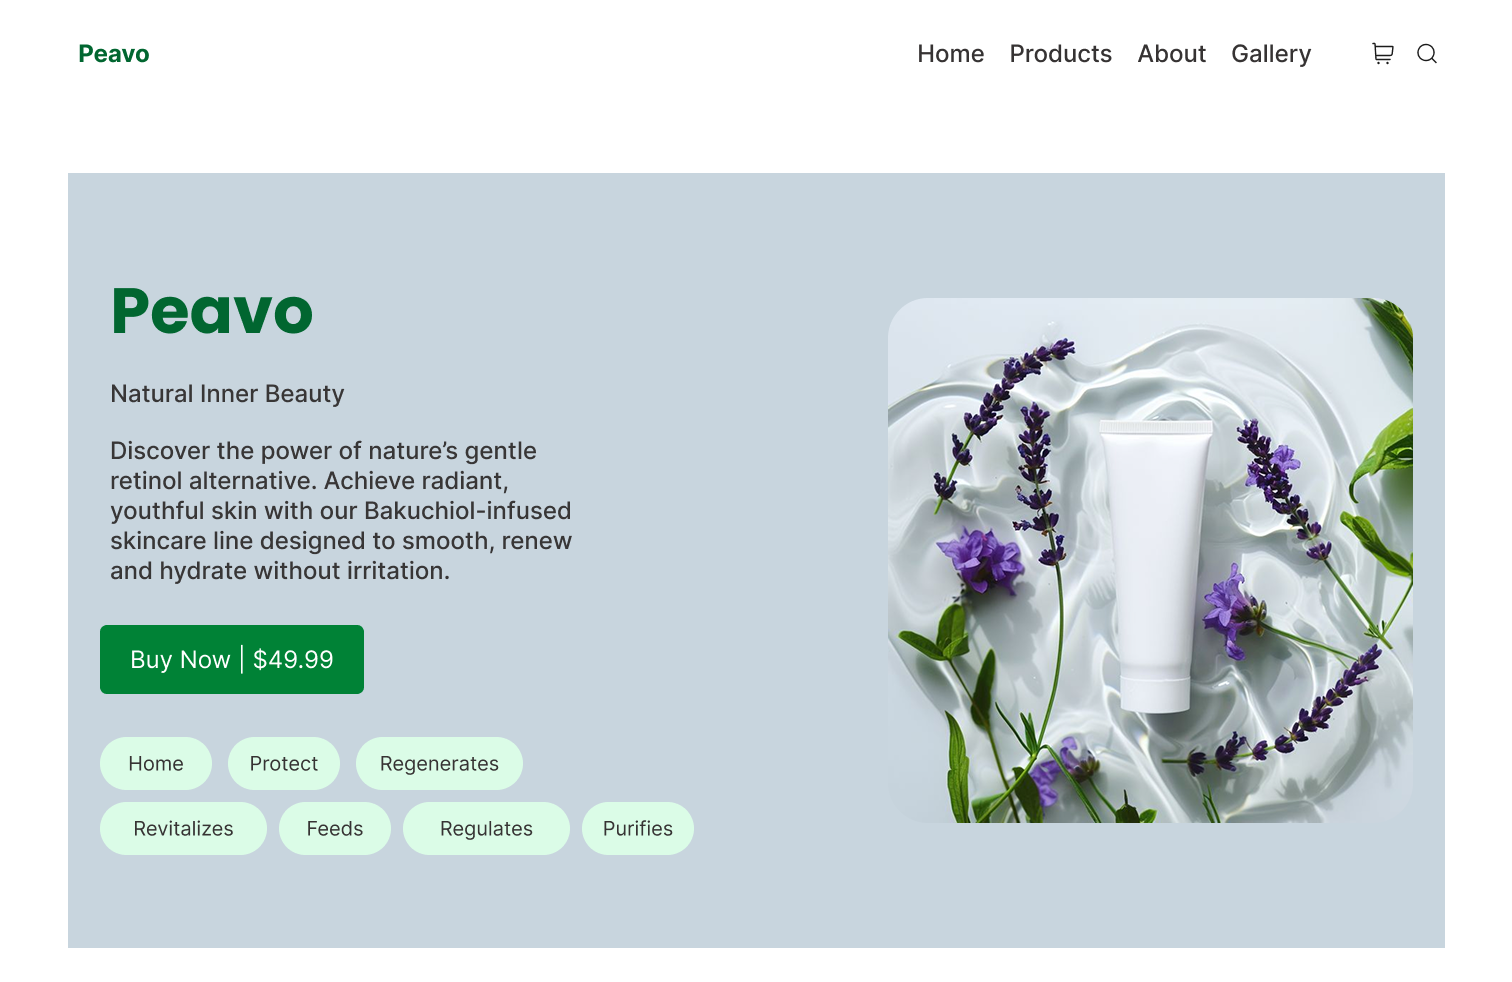
Project 1
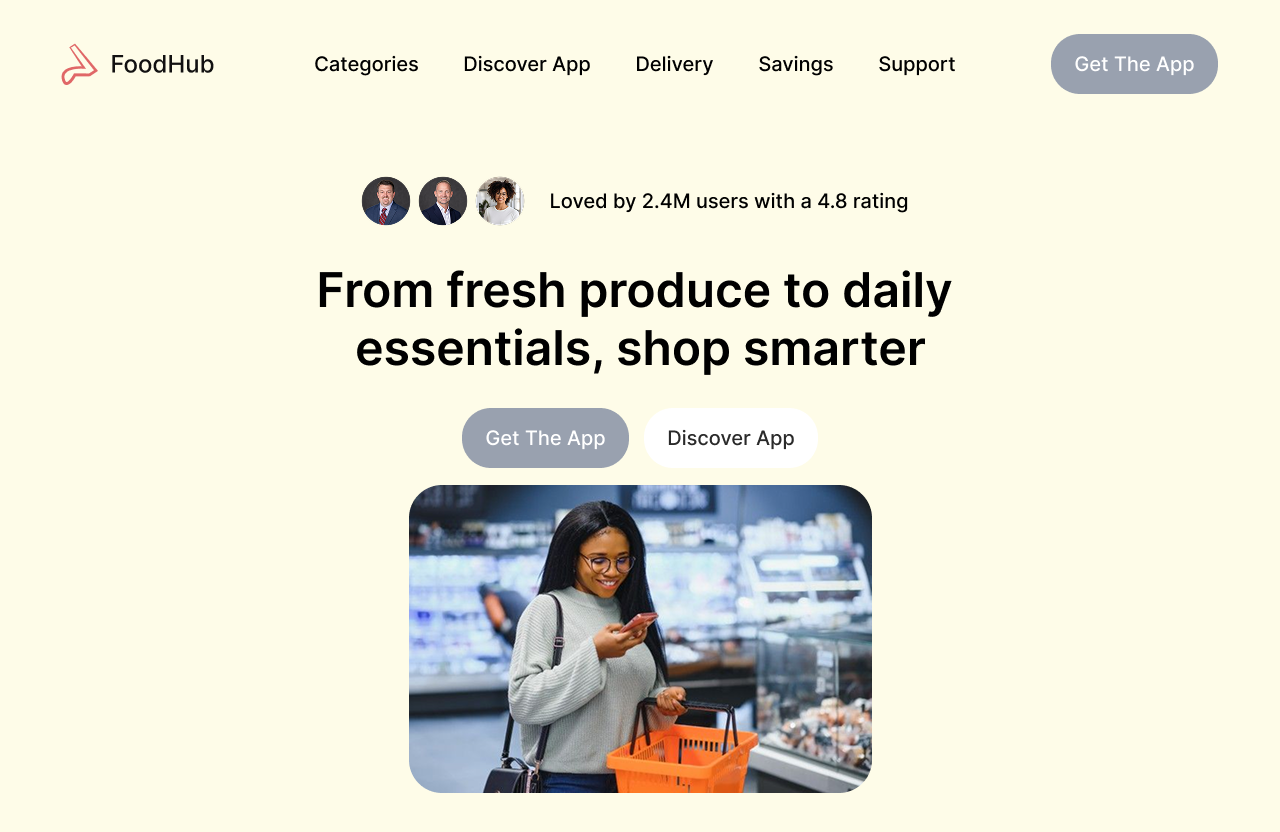
Project 2
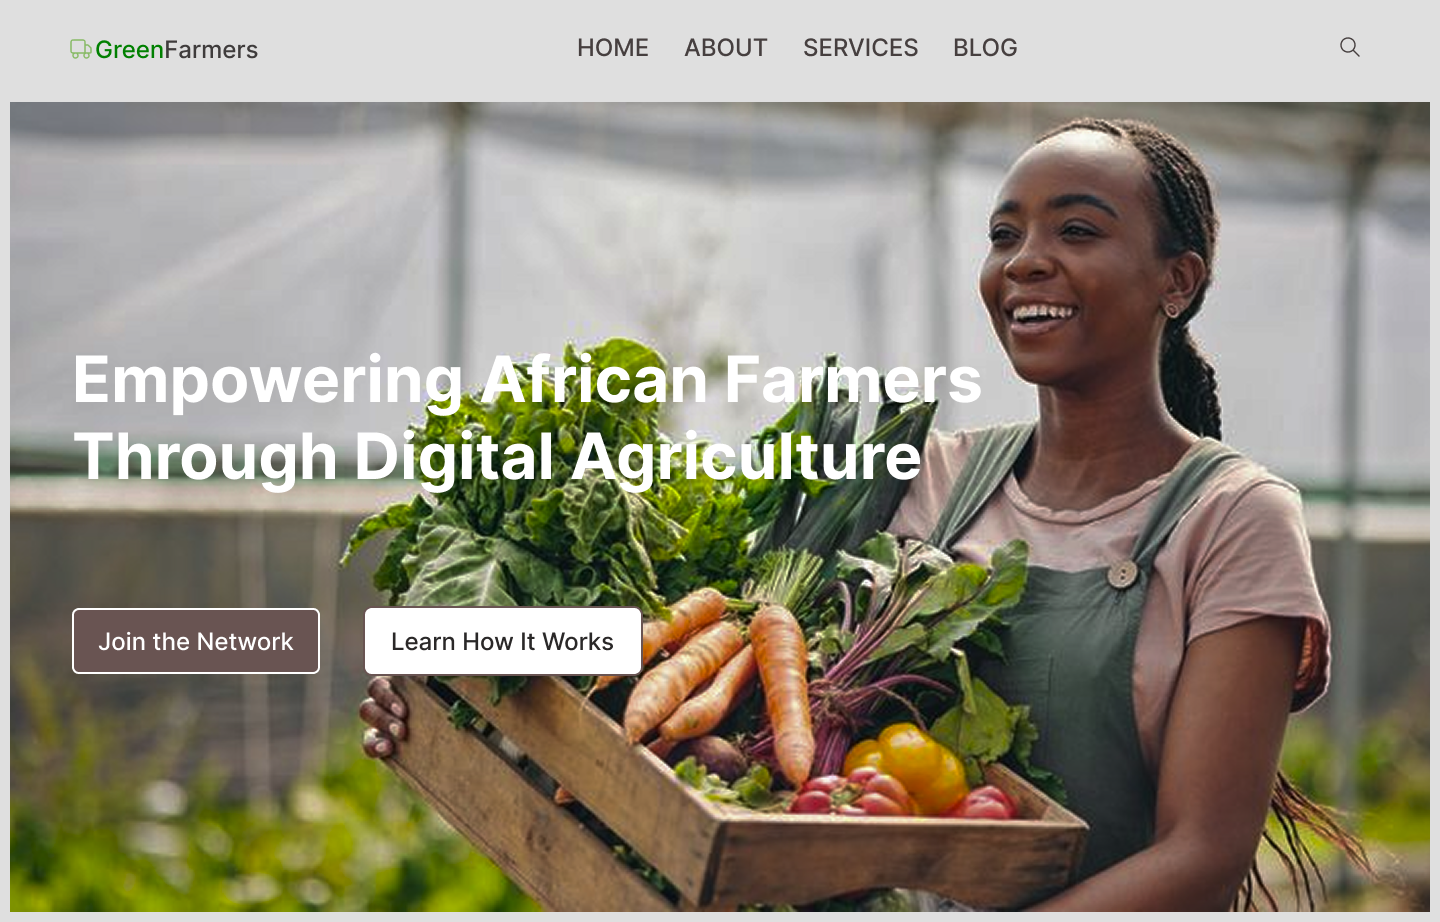
Project 3
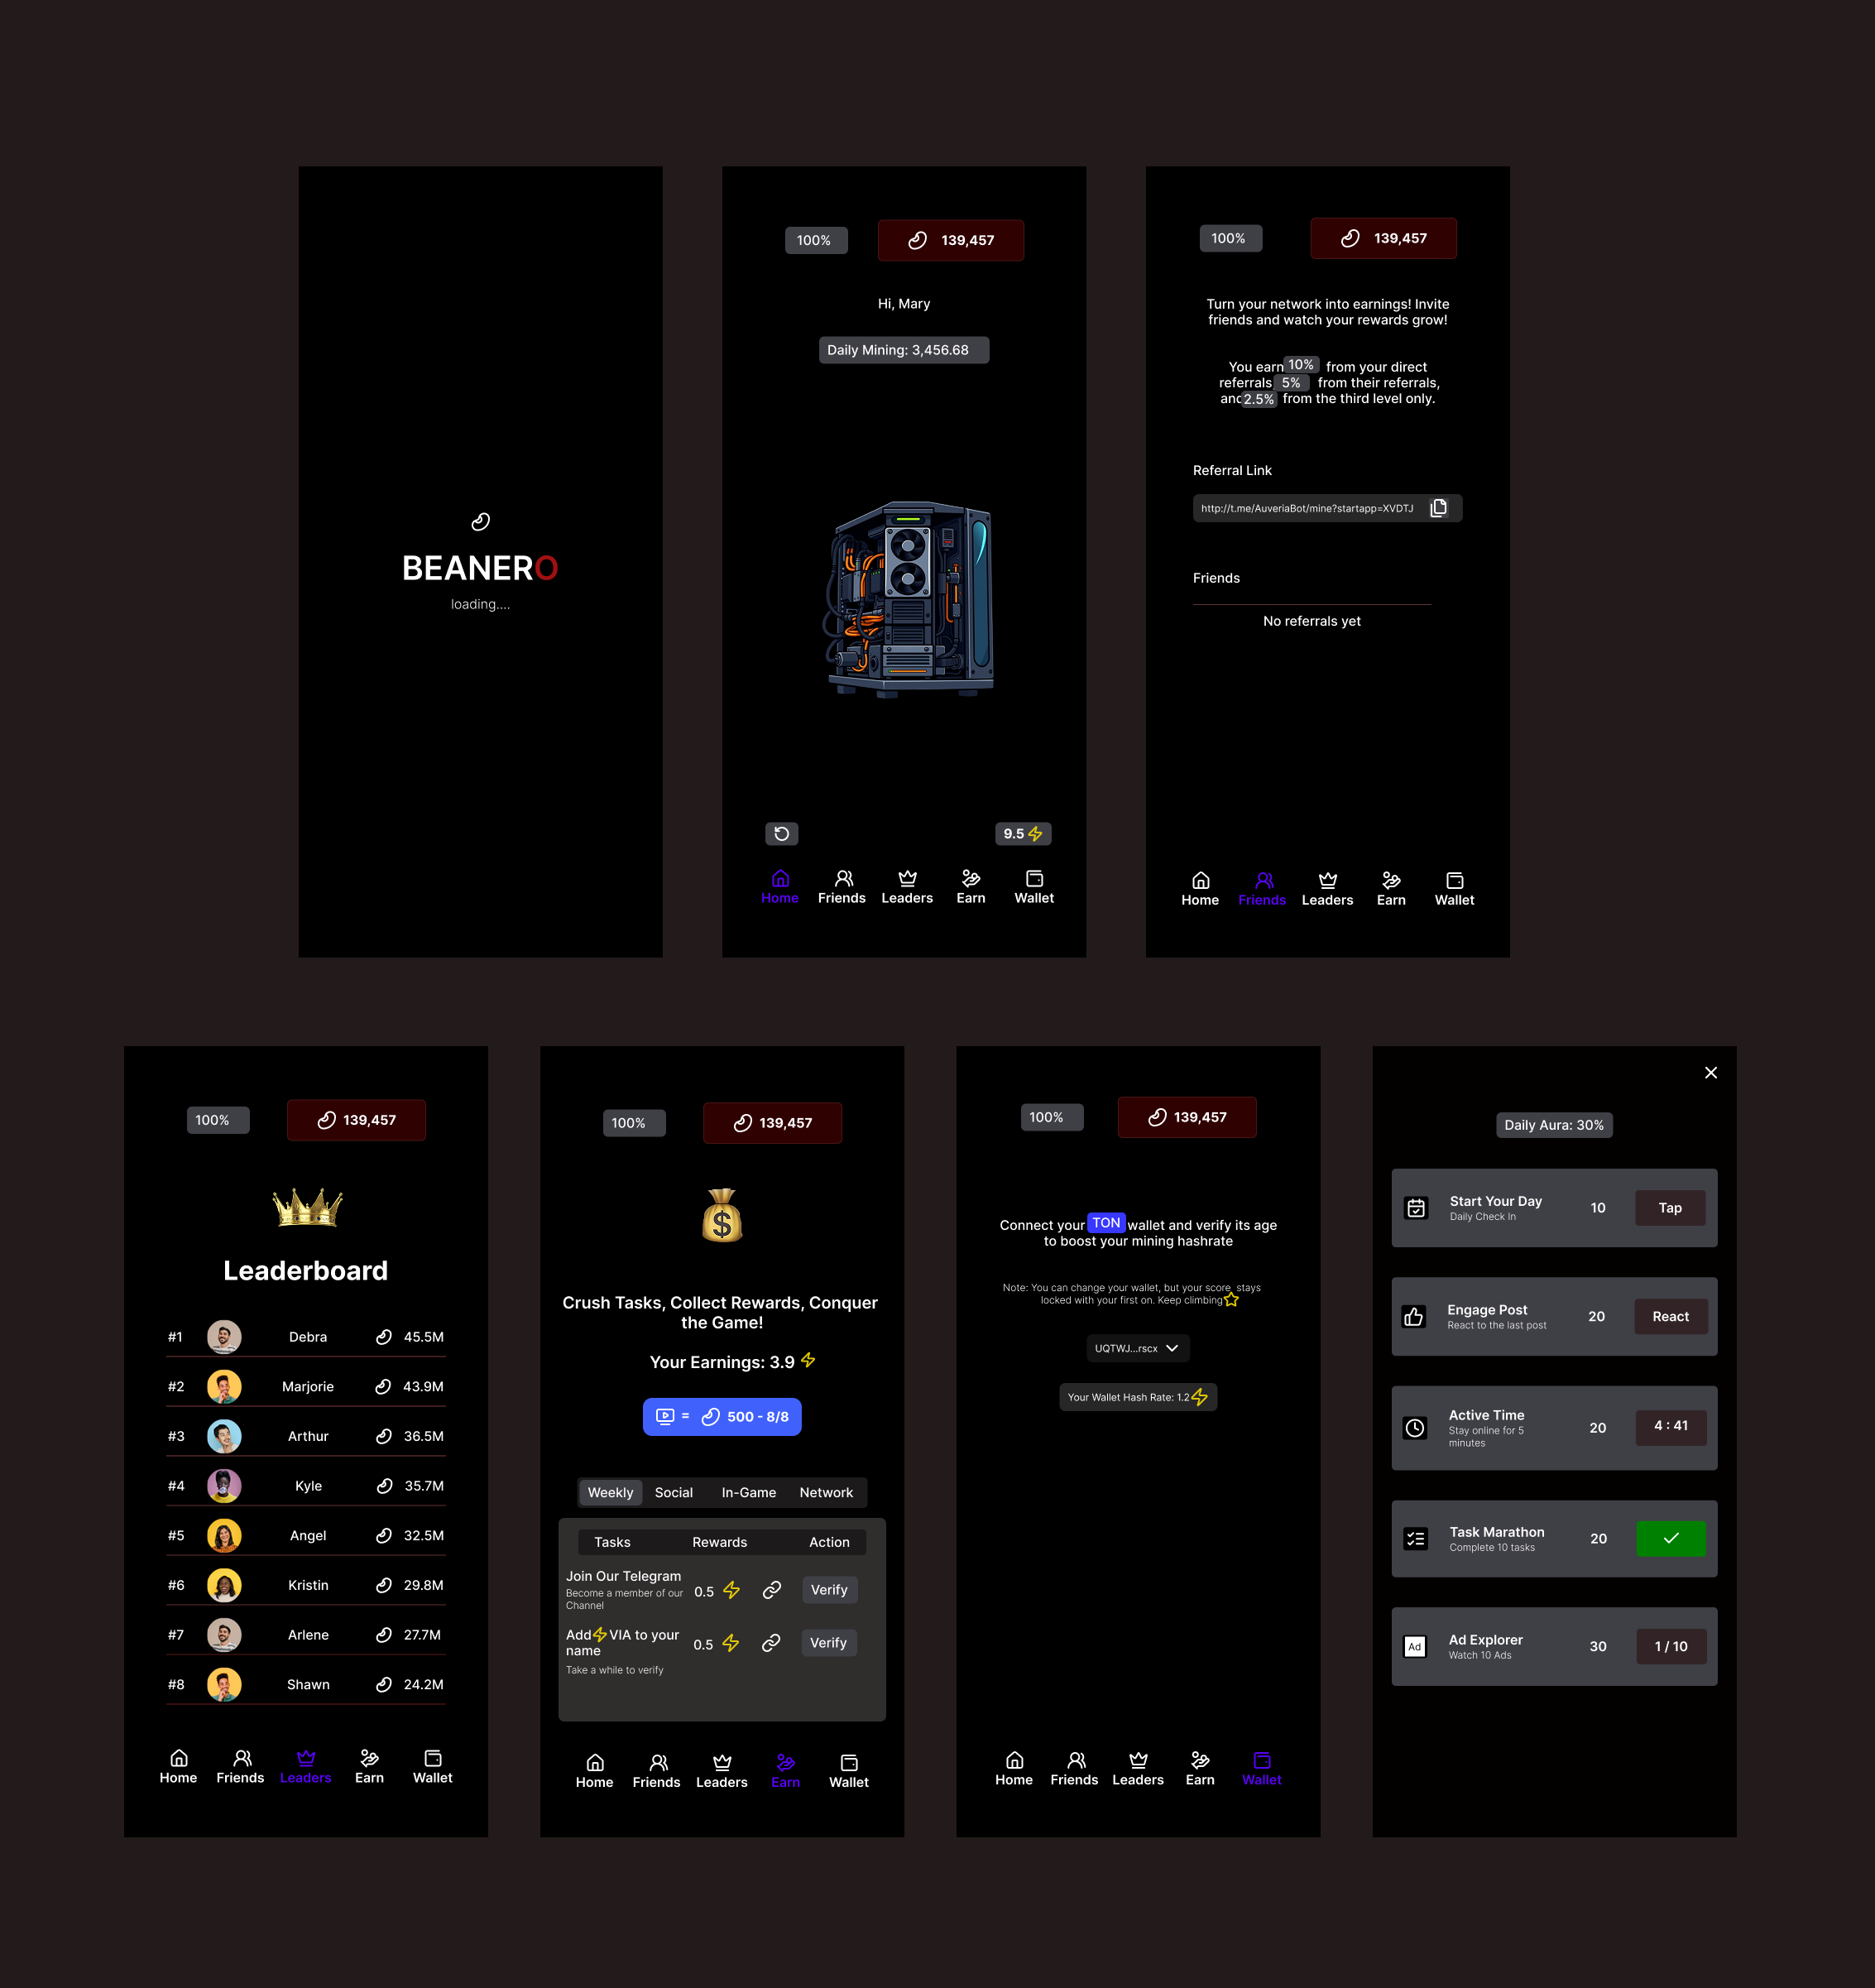
Project 4
Project 5
Project 6
Project 7
Project 8
Project 9
Get In Touch
Contact Me
isiomaochei44@gmail.com
(234) 9015479710
Lagos, Nigeria